
Apartment Pricing Algorithm
Optimizing profitability in high rise residential projects through determining multivariate pricing of units.
Hsin-Ying Huang, JJ Zhijie Jin, Tai Ning, Thomas Wang | Generative Design| Spring 2024| GSAPP
1.Introduction
In the design of multifamily residential buildings, optimizing important factors such as views, bedroom ratios, and square footage to enhance the comfort and enjoyment of the residents, as well as the profitability of the building for the developers, has always been at the forefront. Traditionally, such consideration is taken into account through repetitive iterations and small formal tweaks to elevate profitability and advantages from the views. However, the repetitive back-and-forth nature of the optimization burdens heavy, inefficient tasks on designers that could be unitized elsewhere to enhance user comfort and enjoyment. Thus, the Apartment Pricing Algorithm tool we offer automates the calculation process and provides clients with a final sale or rental price from simple inputs and slider adjustments to shift the user’s attention from manually calculating and adjusting everything to simply deciding their multiplication variable. The tool is proposed with two primary purposes in two stages of design. First, the tool can act as a form optimization tool, analyzing and summarizing if certain forms or orientations of the building can optimize views and square footage more than others. This is a crucial tool for architects and developers to decide on unit and window assignments. The second purpose targets the post-completion leasing team, who can price the units and the multipliers based on a library of preset factors such as location, orientation, and proximity to landmarks. This quick and simple tool allows the leasing team to freely adjust and reach the desired price for rental or condominium sales. The Apartment Pricing Algorithm reduces unneeded repetitive back and forth between pricing and form to optimize profitability in high-rise residential projects by determining multivariate pricing of units.

Fig. 1 Diagram-Project Concept2.Design space model
The primary strategy to determine apartment pricing is a 3D model input with organized layers of elements (windows, room types, walls, etc.) that can be referenced in Grasshopper to calculate a series of attributes. The Grasshopper model involves a input section (top left corner) with adjustable number sliders for the user to determine significance of certain attributes and the various sections computing multipliers that will feed into the final price.


2.1 Methodology
The pricing system involves a simple initial price based on the project location and undergoes a series of positive and negative multipliers based on the input parameters that were researched to be most impactful on rental price.
Fig. 2 Grasshopper model-Overall StrategyFig. 3 Grasshopper model-Total Rent CalculatorThe final rent calculation is simply a mass multiplication with all the various multipliers. There are however different weights that can be adjusted for parameters such as subspace ratio, number of bedrooms and bathrooms, directionality of the unit (window facing), as well as the views visible from the unit. Another key variable input determined by the user is the building level thresholds, which is a key input variable for height-related affector calculations. The first threshold is often the switch between retail/office space and purely residential. The second threshold is the level which surpasses a certain obstruction (e.g. another tall building in proximity to the apartment), and the final threshold is the switch from regular units to penthouse units, which has a significant price jump as it is a different product.
2.2 Subspace Ratios (Negative Multiplier)

Fig. 4 Grasshopper model-Subspace Ratio(Negative Multiplier)Subspace ratio (how much of the unit area is living room, bedroom, bathroom, etc.) is determined through a combination of simple difference and division calculations with grasshopper modules as well as a python script (Subspace Ratios) that returns specific ratio values. The subspace ratio calculates how much the various rooms deviate from ‘optimal’ allocation of the spaces and the further it deviates, the greater the negative multiplier becomes.

Fig. 5 Python Script-Subspace Ratios2.3 Number of Bedrooms/Bathrooms (Positive Multiplier)
2.7 Landmark Obstruction (Negative Multiplier)
In contrast to the overall view quality, the landmark obstruction calculation results in a negative multiplier, where if the unit is in visual proximity to a landmark but has visual obstructions, it detracts from the unit by a small percentage. This is calculated by using the mesh ray intersection component with various vectors going from windows to a layer of landmark building breps that are converted into meshes.

Fig. 6 Grasshopper model-Number of Bedrooms/BathroomsNumber of bedrooms and bathrooms is a significant multiplier with the simplest computation, as it simply takes the given multiplier (adjustable by the user) to adjust to the power of however many spaces there are. The number of rooms is determined by a list length component of the various bedroom/bathroom surfaces in the Rhino model.
2.4 Window Directionality (Positive Multiplier)
The window directionality is determined by using the normal vectors of the window breps compared to a south facing vector. These angles are taken as a modulus value, converted into a multiplier and averaged out based on the surface area of the windows. For example, if half the windows were at a multiplier of 1.1 and half were at 1.2, it would result in a final multiplier of 1.05.
2.5 Floor Level (Positive Multiplier)
Floor level is determined by taking the z component of the windows supplied and dividing by floor to floor height. The unit level is inputted into a python script (Unit Level Price Multiplier) which involves calculating a variable percentage increase based on market research.
2.6 Overall View Quality (Positive Multiplier)
Overall view quality is determined through ladybug’s view percent component, which evaluates how much of the exterior is visible without obstruction. The view plane floor is 5 feet above the floor and with an additional 1’ offset, it determines views at a 6 feet viewing height. The results are computed with a ray intersection method that outputs a series of percentages which are averaged and converted into a decimal to be used as an additional multiplier.
3.Input Parameters
The Apartment Pricing Algorithm multipliers, derived from research on factors impacting rental prices in multifamily residential buildings, utilize a series of positive and negative multipliers based on key input parameters known to significantly influence rental prices.
3.1 Subspace Ratios
Subspace ratios, which determine the allocation of unit area to different rooms, serve as negative multipliers in the pricing algorithm. Research suggests that optimal space allocation is crucial for user satisfaction and property value. Deviations from this optimal allocation result in greater negative multipliers, such as oversized living rooms or undersized bedrooms, which can negatively impact the desirability and, consequently, the rental price of a property.
3.2 Number of Bedrooms/Bathrooms
The number of bedrooms and bathrooms serves as a significant positive multiplier in the pricing algorithm. Studies have consistently shown that the number of bedrooms and bathrooms directly influences rental prices, with each additional room commanding a higher price. The simplicity of this computation underscores its importance in reflecting the value of living space.
3.3 Window Directionality
Window directionality, determined by the orientation of windows relative to cardinal directions, acts as a positive multiplier. Studies have indicated that the orientation of windows within a residential unit can significantly impact its perceived value and rental price. Units with windows facing desirable directions, such as south-facing windows that provide ample sunlight and scenic views, are often priced higher than units with less favorable window orientations. By averaging out the angles of window orientations and assigning appropriate multipliers, the algorithm accurately captures the perceived value added by favorable window configurations.
3.4 Floor Level: Positive Multiplier
Floor level, representing the vertical position within the building, is another positive multiplier in the pricing algorithm. Market research suggests that higher floors often command premium prices due to enhanced views, privacy, and prestige. By incorporating variable percentage increases based on floor level, the algorithm accounts for height-related factors affecting rental prices.
3.5 Overall View Quality
The overall quality of views from a residential unit serves as a positive multiplier in the pricing algorithm. Studies have shown that unobstructed, scenic views positively impact property value and tenant satisfaction. Leveraging advanced evaluation methods, such as Ladybug’s view percent component, allows the algorithm to accurately assess view quality and assign appropriate multipliers.
3.6 Landmark Obstruction
In contrast to overall view quality, landmark obstruction serves as a negative multiplier in the pricing algorithm. Research on urban planning and real estate valuation suggests that visual obstructions, such as nearby landmarks or buildings, can negatively impact the desirability and rental price of a residential unit. Units with obstructed views or visual proximity to landmarks may experience reduced demand and, consequently, lower rental prices compared to units with clear views.By accounting for landmark obstructions, the algorithm ensures fair and accurate pricing reflective of unit attributes and potential limitations.
In conclusion, the pricing algorithm’s multipliers, informed by extensive research on factors influencing rental prices, enable accurate and customizable pricing for multifamily residential buildings. By incorporating both positive and negative multipliers, the algorithm provides a comprehensive framework for assessing property value and optimizing rental income.
4. Performance Metrics
In our design process, we swiftly evaluate these metrics through a dynamic combination of real-time adjustments and iterative simulations within Grasshopper and Rhino. This rapid prototyping and optimization of designs ensures we stay ahead of the curve. The constraints, such as subspace ratios and landmark obstructions, keep our designs within acceptable limits, while the objectives, like maximizing the number of rooms and improving view quality, propel our designs toward higher market value and tenant satisfaction.
4.1 Optimization of Interior Spaces
We leverage Grasshopper and Python to implement constraints that ensure optimal room configurations, adhering to high usability standards throughout each apartment unit. Simultaneously, the count of bedrooms and bathrooms, determined using Rhino’s list length component, is maximized as an objective. This approach directly responds to market demands, aiming to enhance space efficiency and elevate the property’s market value.
4.2 Maximization of Natural Light and Value of Higher Floors
Then, window orientation is meticulously analyzed through vector calculations in Grasshopper to optimize natural light and enhance energy efficiency. The vertical positioning of windows determines the valuation of floor levels, with higher floors commanding a premium due to their superior views and quieter environments. These strategies are central to our sustainability goals and offering a luxurious living experience.
4.3 Optimization of View Quality and Minimization of Visual Obstructions
Our commitment to quality is evident in the rigorous assessment of the view quality from each unit using Ladybug’s ray intersection method. Our objective is to maximize unobstructed views, thus boosting the attractiveness and comfort of the living spaces. Conversely, the metric for landmark obstruction employs similar simulation methods to act as a constraint, minimizing any visual blockages. These focused measures are crucial in enhancing tenant satisfaction and leveraging the property’s prime location to optimize rental appeal and pricing.
Through a sophisticated design space model, the algorithm leverages Grasshopper and Python scripts to compute multipliers based on key factors such as subspace ratios, number of bedrooms and bathrooms, window directionality, floor level, overall view quality, and landmark obstruction. These multipliers collectively determine the final sale or rental price, empowering stakeholders to make informed decisions efficiently.
By eliminating redundant back-and-forth between pricing and form optimization, the Apartment Pricing Algorithm enables designers to focus on enhancing user experiences and maximizing profitability in high-rise residential projects. This innovative approach marks a significant advancement in the field, promising greater efficiency, accuracy, and flexibility in multifamily residential building design and pricing strategies.
6. Research reference
Cohen, A. S., & Cohen, S. S. (2016). “The Effect of Space Allocation on Residential Property Values.” Journal of Real Estate Research, 38(4), 563–585.
Goodman, A. C., & Thibodeau, T. G. (2014). “Where Are the Property Taxes?” Journal of Urban Economics, 79, 101–111.
Stevens, R., & Yen, B. (2015). “The Impact of Window View and Light on Residential Property Value.” Journal of Real Estate Research, 37(3), 381–402.
Franzini, L., & Narendranathan, W. (2014). “The Relationship between Floor Level and Housing Values.” Urban Studies, 51(1), 155–170.
Feng, Y., & Ling, D. C. (2017). “The Impact of Views on Apartment Prices: Evidence from a Natural Experiment.” Journal of Urban Economics, 98, 1–13.
Li, X., & Brown, G. (2018). “Assessing the Influence of Landmarks on Property Values Using GIS.” International Journal of Geographical Information Science, 32(8), 1577–1597.
5. Conclusion
The Apartment Pricing Algorithm offers a transformative solution to the intricate challenge of optimizing multifamily residential building designs. Traditional approaches rely heavily on manual iterations, leading to inefficiencies and lost opportunities to enhance user comfort and profitability. By automating the calculation process and integrating adjustable parameters, this tool streamlines decision-making for architects, developers, and leasing teams.

Fig. 7 Grasshopper model-Window Orientation
Fig. 8 Grasshopper model-Height Factors Multiplier
Fig. 9 Python Script-Height Factors Multiplier
Fig. 10 Grasshopper model-Quality View
Fig. 11 Grasshopper model-Landmark ObstructionFig. 12 Diagram-Window Orientation
Fig. 13 Diagram-Quality View
Fig. 14 Diagram-Landmark Obstruction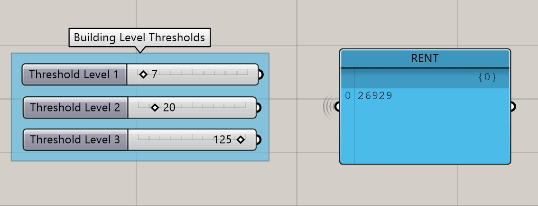
Fig. 15 Grasshopper model-Rent Calculator On Floor Level